Borehole Pump Test

We are looking for the simplest borehole pump test possible to have one tangible piece of evidence about in-situ borehole capacity. Working to support rural Syrian communities to move from centralised water systems to using normally existing boreholes in villages or fields.
Our agency wants to develop a simple procedure to provide basic borehole information:
- depth
- SWL
- DWL
- sustainable production capacity m3/hr or simply to see if the borehole meets the community need over a maximum 10 hour pump time.
Information will be used to provide best most efficient pump size, therefore generator size. Pump/generator sizing is critical in that oversizing will cause unneeded costs for the communities and therefore run a greater risk for project failure.
Full details of technical support request : Simple Borehole Capacity Test - multiple wells. The idea is to train and equip a partner to carry out pump tests in villages. Objective - know if borehole can achieve desired volume of water per day.
We are working on 50LPD (for now) as water is crucial to indoor sanitation in villages. Typical village may need 400,000 Litres per day.
Information available example: BH1: depth of 400m, SWL 265m, pump 60 HP, production of 30 m3 BH2: depth 400m, SWL 240m, pump 40 HP, production 20m3 without pumping line and with a connection to pumping line is 16 m3
To make a decision based on something tangible we want to test the borehole. Probably some variation on a step pump test.
Questions to answer:
- what is the procedure
- what equipment is needed
- how do we analyse the results - e.g. graph
Remember much of this is being done remotely.
2 Answers
The best source of information that I can recommend for planning the physical aspects of the tests is BS ISO 14686, available for Download at https://shop.bsigroup.com/. For analysis of the data the best resource available is Analysis and Evaluation of Pump test data, available at https://www.hydrology.nl/images/docs/dutch/key/Kruseman_and_De_Ridder_2000.pdf.
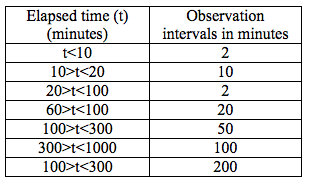
A step draw down test will provide the design data that you are looking for. In order to determine the performance of the well under production conditions a Constant rate drawdown test will be required. This would normally be followed by monitoring the recovery levels in the well. Observation of water levels can be carried out using a manual dipper, preferably with an optical indicator. The frequencies in the table below are suitable for both tests. All of the tests can be carried out as single well tests (no observation piezometers required). For recovery tests a non return valve is absolutely necessary.
Table 5-6: Observation frequency by pump test phase. Source BS ISO 14686: 2003 Hydrometeric Determinations. Pumping tests for water wells. Considerations and guidelines for design, performance and use, Table 1, p.g. 11
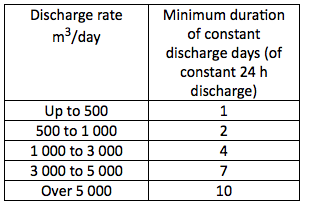
Minimum duration of Constant Discharge tests. Source BS ISO 14686: 2003 Hydrometeric Determinations. Pumping tests for water wells. Considerations and guidelines for design, performance and use, Table 1, p.g. 11
Recommended discharge rate increments for Step Drawdown tests:
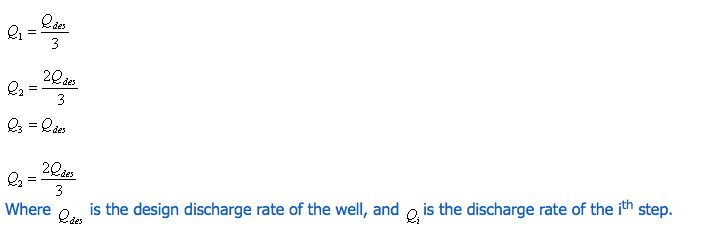
These rates are guidelines only. In designing the flow rates must be chosen to ensure that the drawdown does not cause the water level to drop below the level of the pump intake. Steps of 2 hours are normally sufficient. The time drawdown data from the step test can be used directly in the analysis of the pump test data if steady state has been achieved by the end of the pumping step. If steady state conditions have not been achieved the time drawdown data should be corrected according to the method of Hantush-Biershenk before the analysis can be completed. See (Kruseman & de Ridder, 1994) for detailed description of this procedure. The step drawdown test is based on the Jacobs equation, see below
Equation 5 3: Jacob Equation
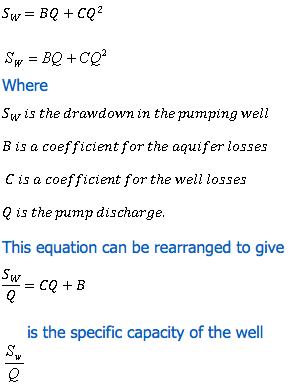
A plot of the specific capacity against pump discharge will be linear. The slope of the line will be equal to C. The intercept of the line with the with the Q axis will be equal to the value of the B, the well loss coefficient. Once calculated these coefficients are used to determine the drawdown levels in the well and the design pumping rate.
Ideally the test should be supervised by a qualified hydro geologist. If this is not possible then, in theory, if a standard format for data collection (see below) is used this could be analysed remotely, and the quality of the data post test could be quality checked by a hydro geologist. Please not that there is no such thing as a standard aquifer and consequently no such thing as a standard well or pump test ...
Comments
We are trying to resolve the mis print above regarding the format of tables and information within them. Thank you for your patience. Pauline Regan REDR
Thank you @RedR TSS, and thanks John C, we are looking into better formatting of tables and equations, but in the meantime the answer above has been formatted using images. Hope to be adding these features soon.
Please see the attached manual, as I think it answers most of the questions:
It’s a simple guide to test pumping that I wrote for the ICRC. It’s also available from their website here.
Hope that helps,
Richard.
Richard Boak, Independent Hydrogeologist
This thread is public, all members of KnowledgePoint can read this page.


